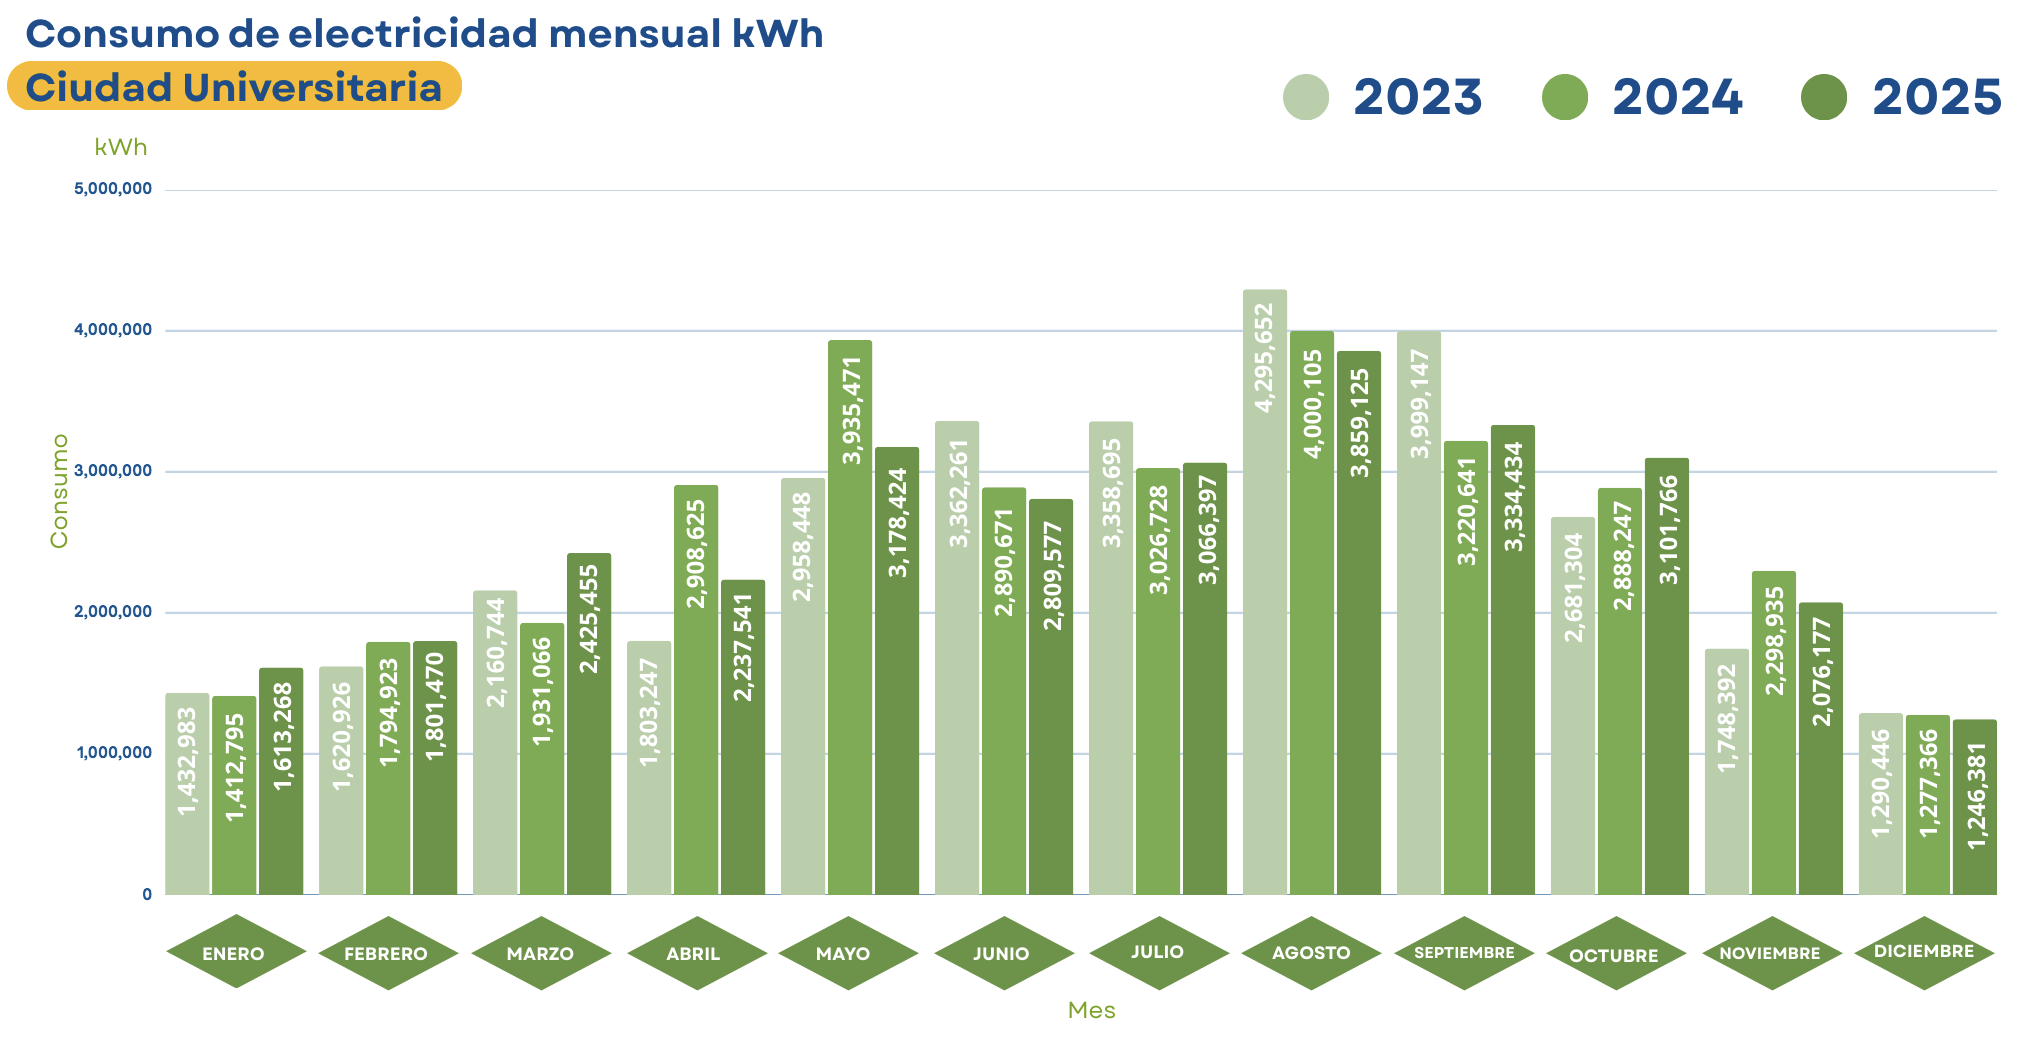
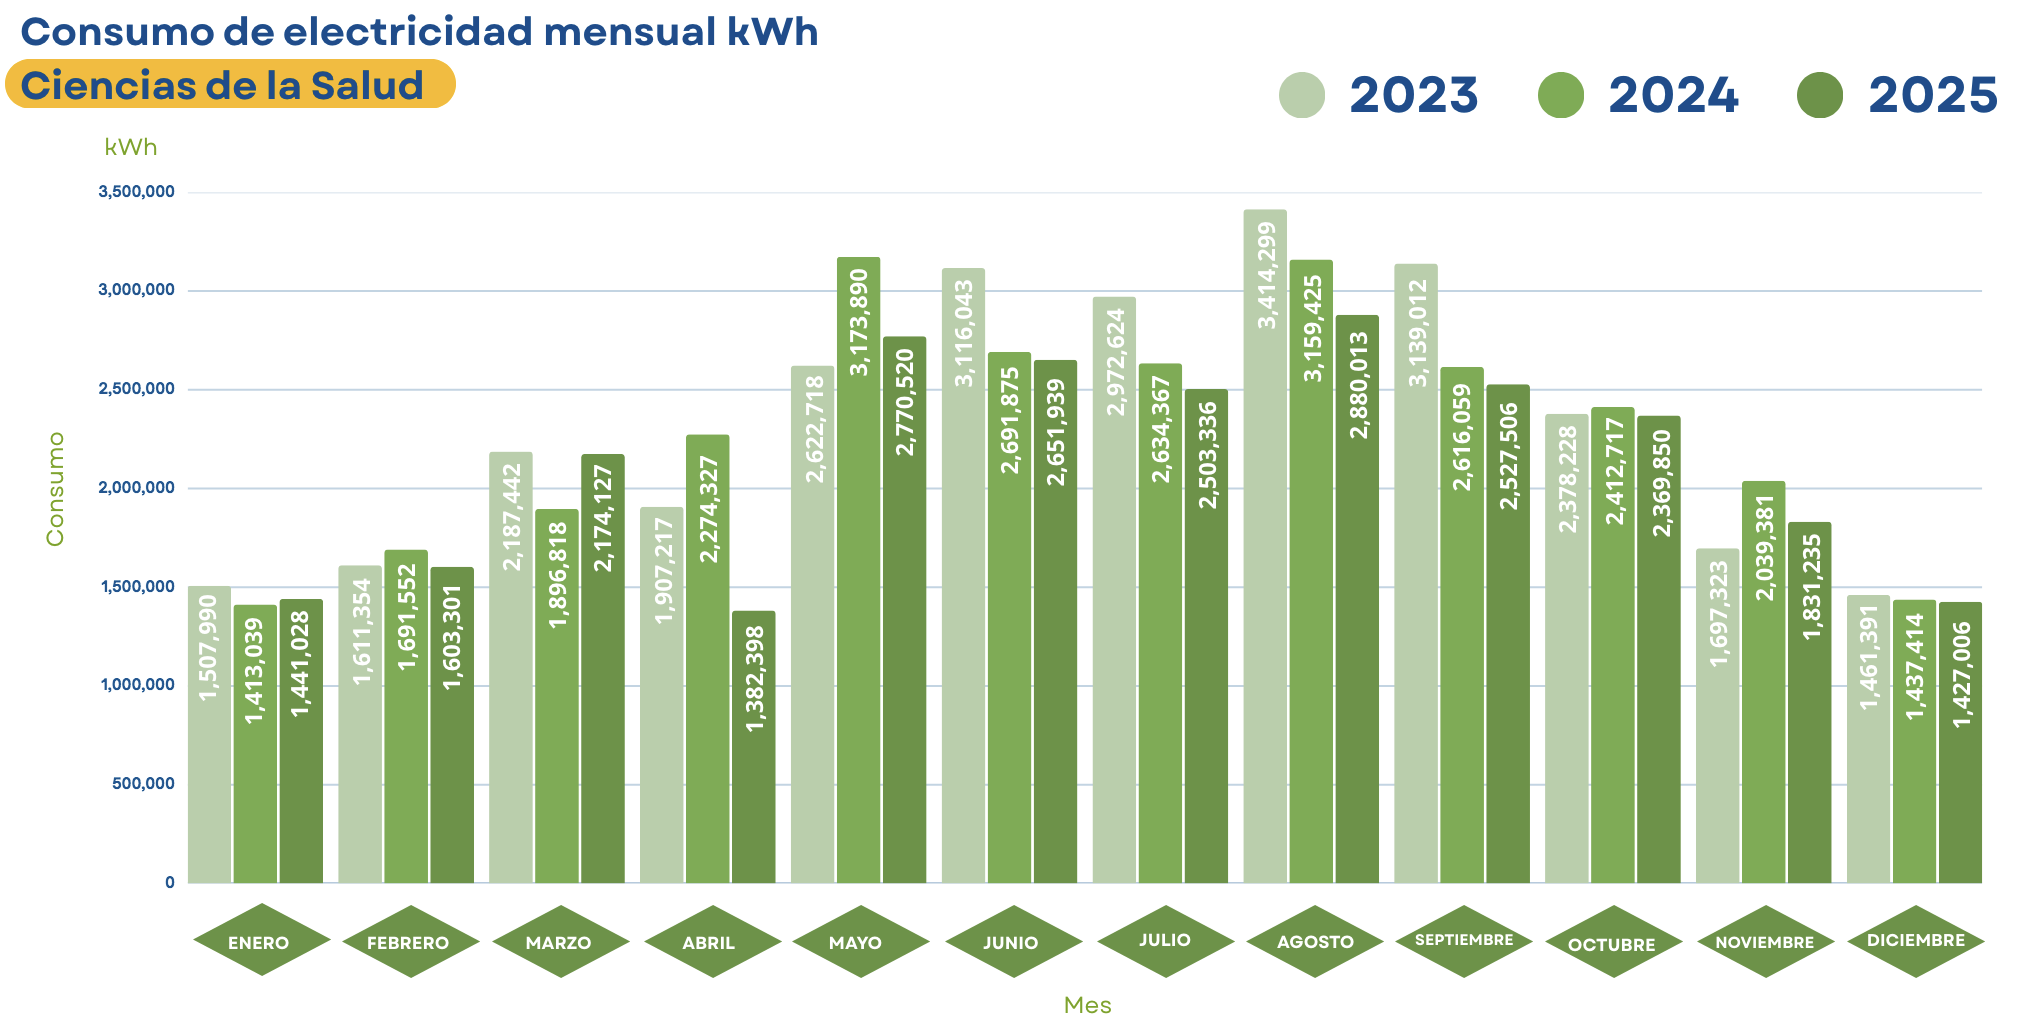
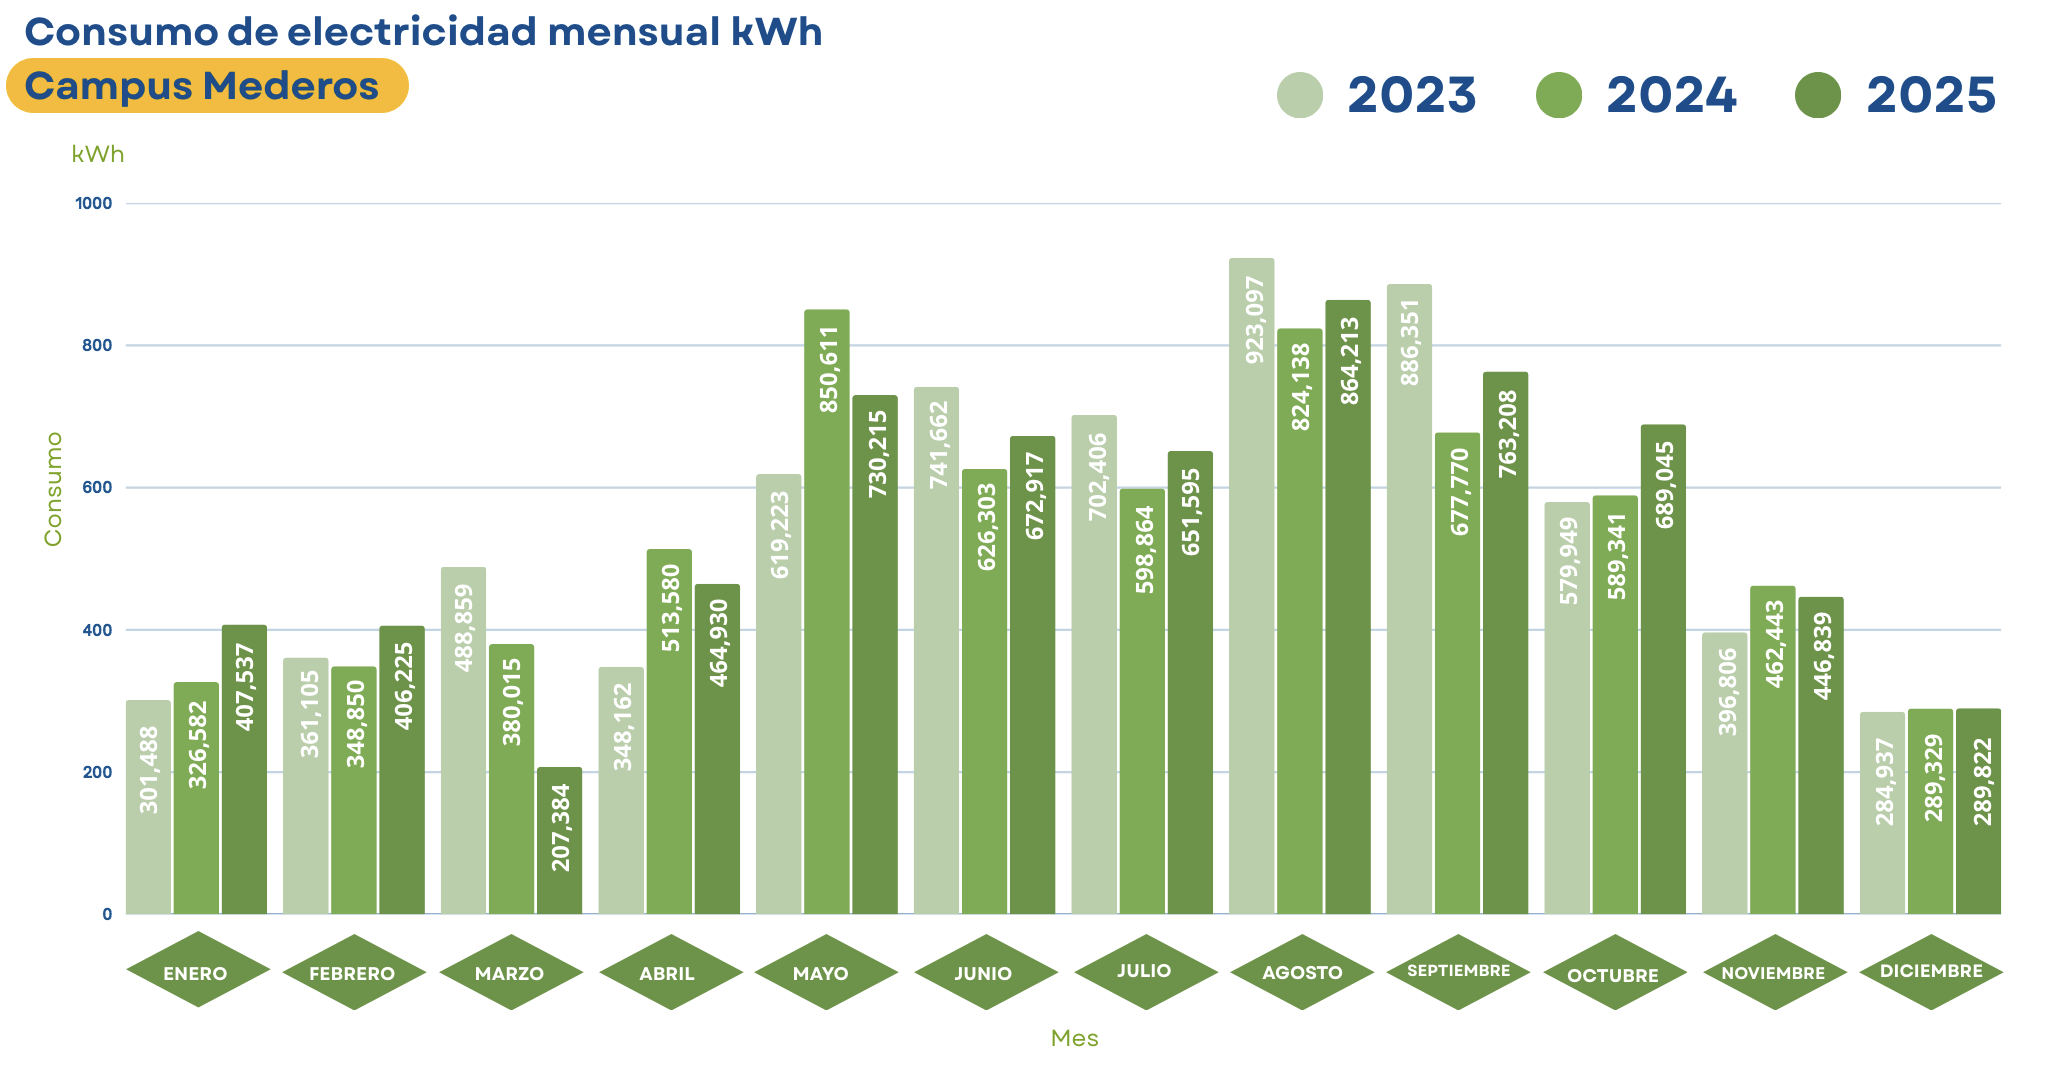
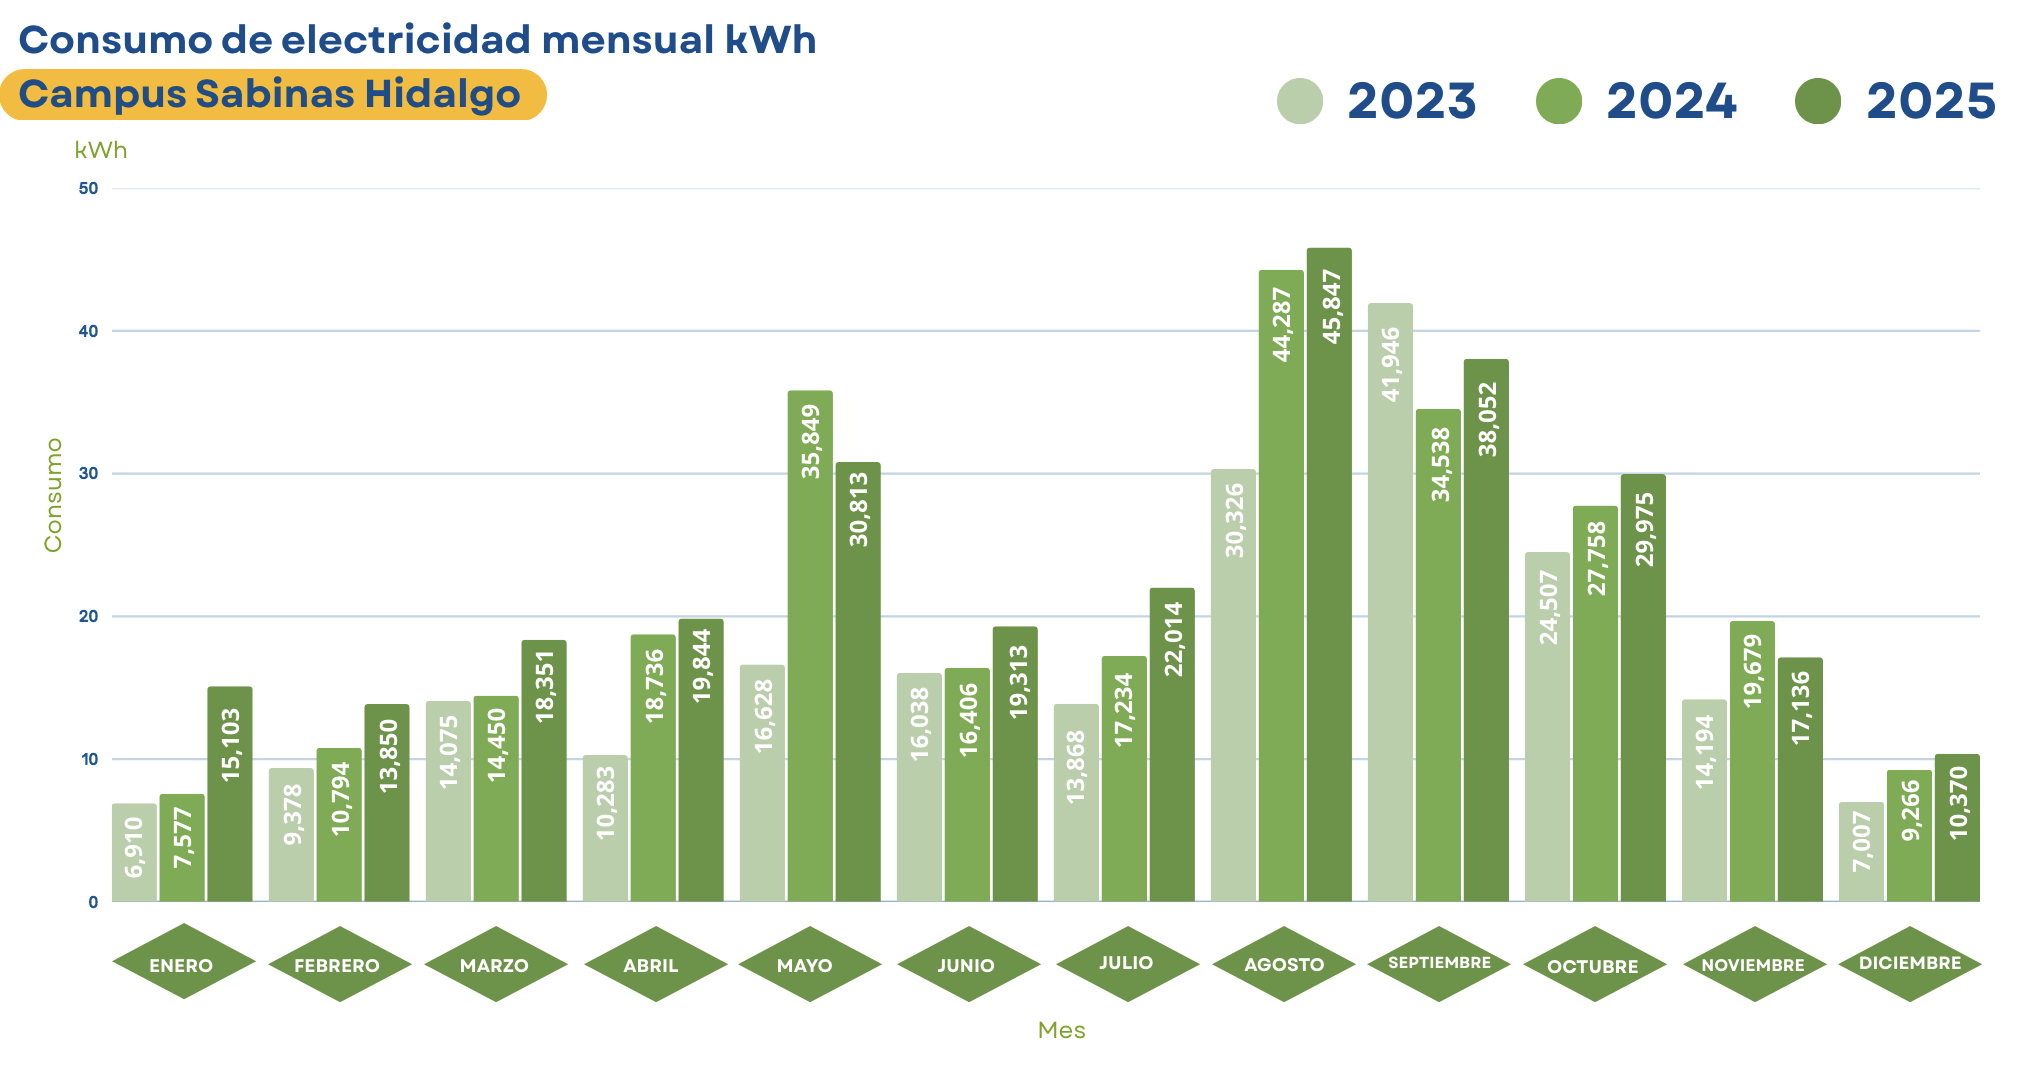
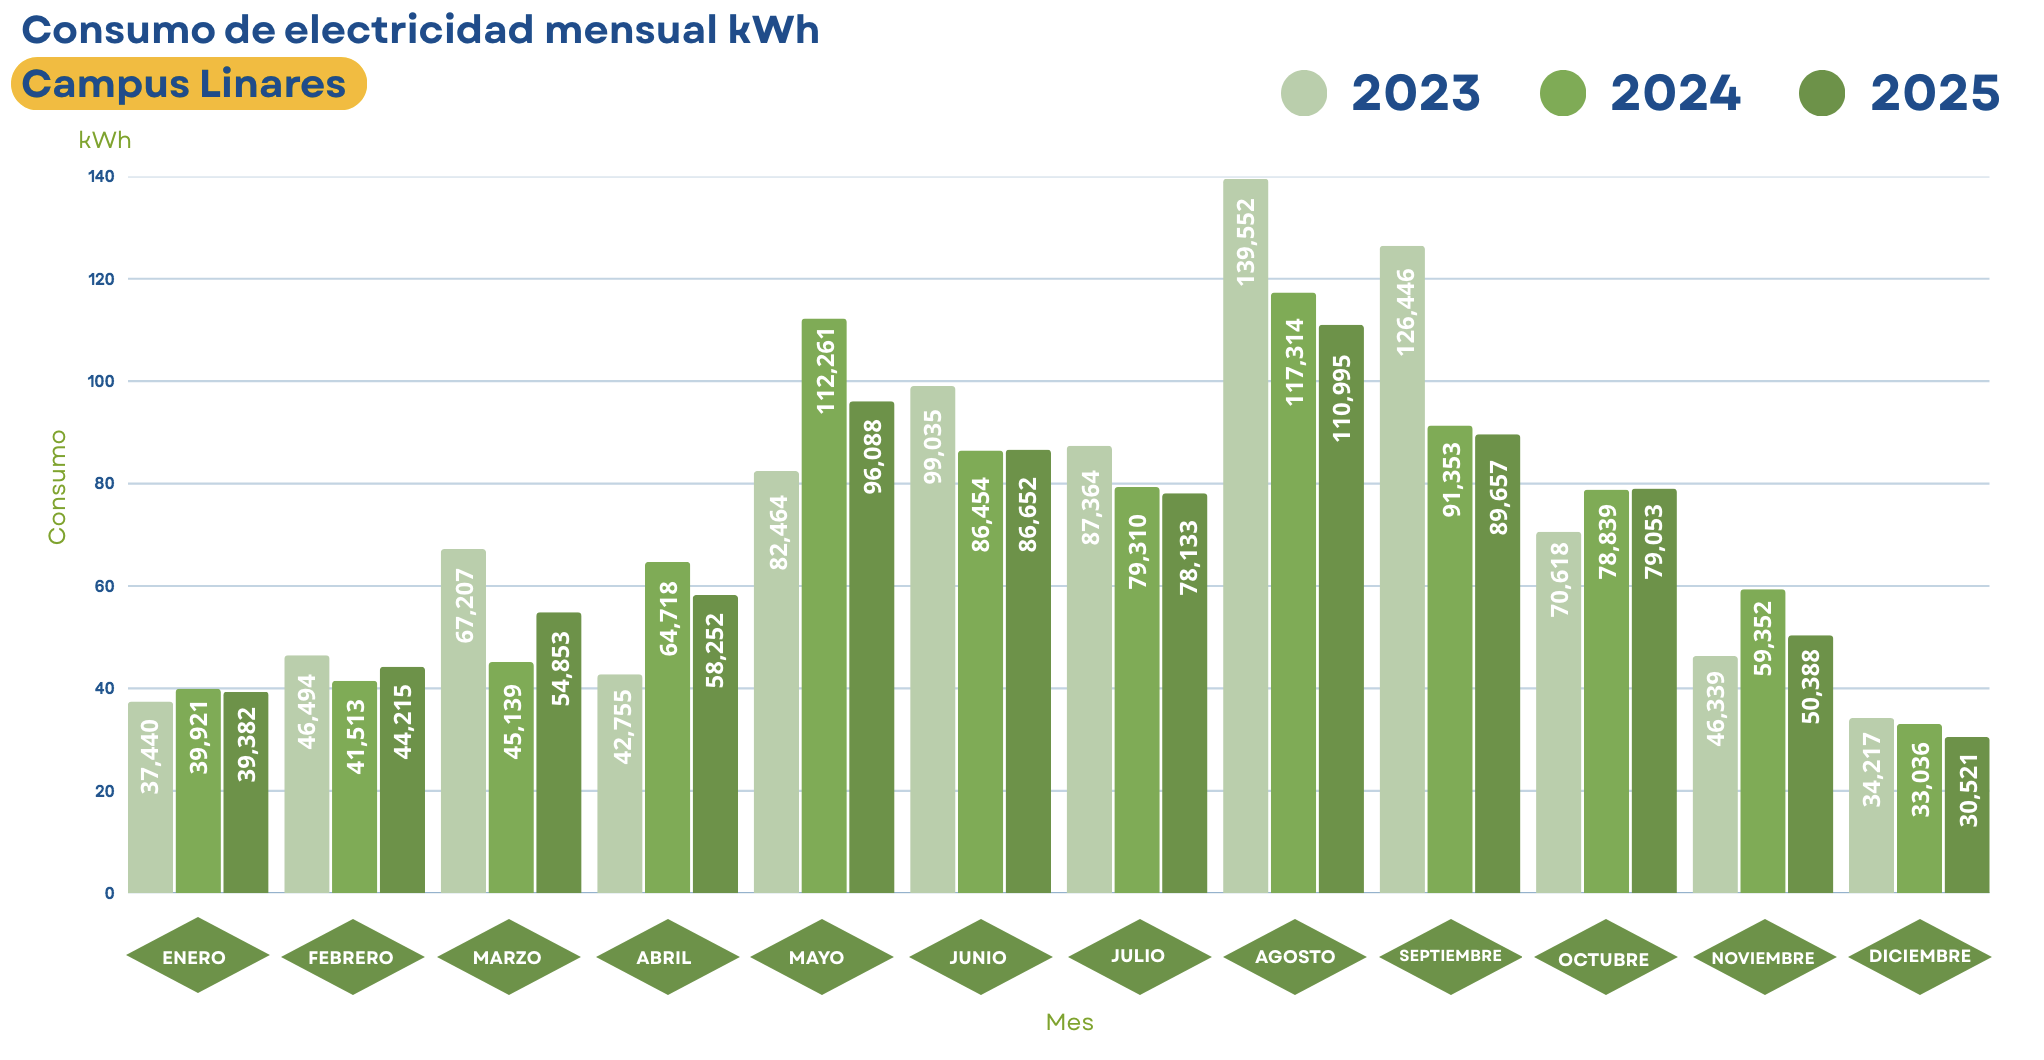
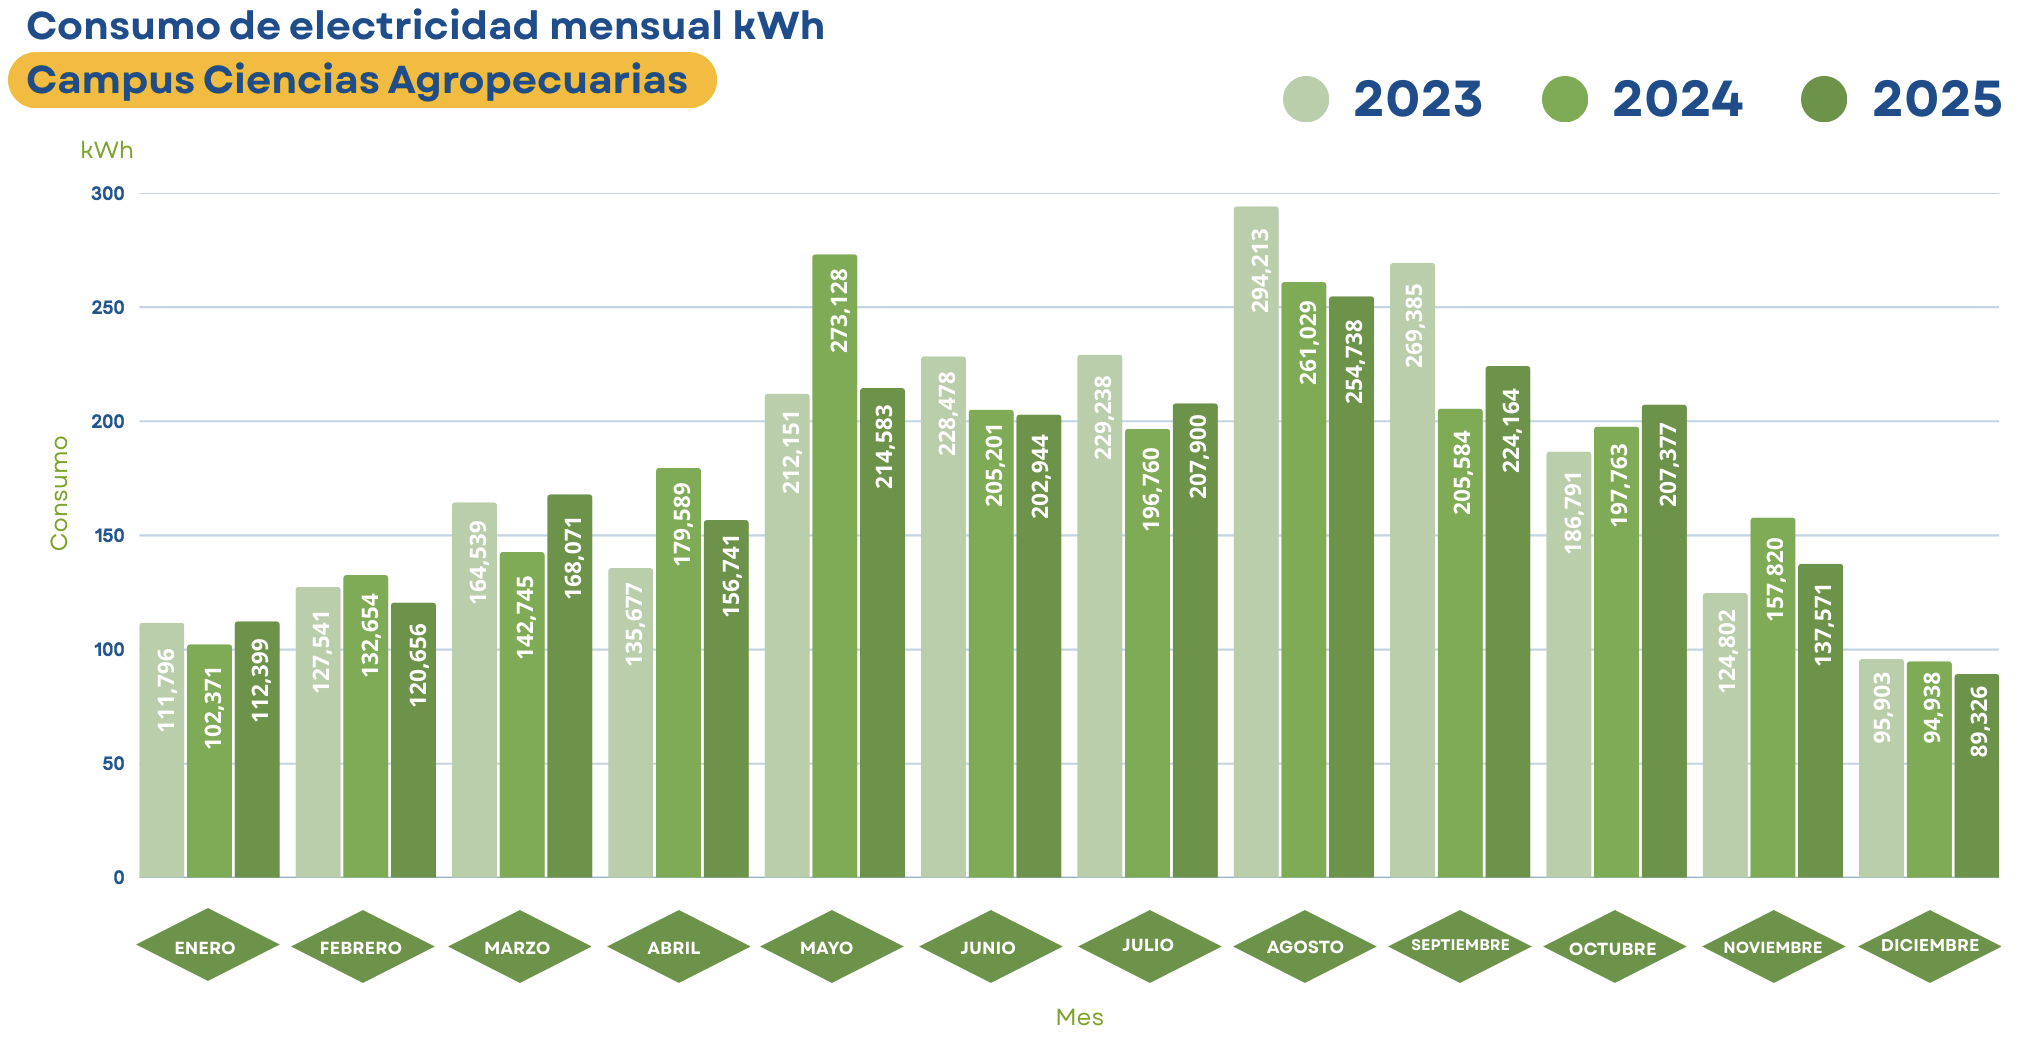
En el presente apartado, se analizan detalladamente las gráficas de consumo de energía en la Universidad Autónoma de Nuevo León (UANL) a lo largo del año 2025.
These visual representations provide a comprehensive view of how energy was distributed and used across university facilities, highlighting consumption patterns, seasonal fluctuations, and potential areas for energy efficiency improvement.
Through this graphical exploration, we seek to better understand the environmental and economic impact of UANL's energy operations, thereby providing a basis for future energy use optimization initiatives.

 English
  Spanish